Null models for public opinion dynamics

Over the last decades, computational social science has risen as a strongly empirical discipline, drawing on data science methods to tackle datasets that cannot be understood with simple analytical tools. This is particularly true in the study of public attention and news coverage: there are numerous studies looking at large-scale trends in Internet search queries and online petitions or applying natural language processing methods to news articles or social media activity. In other words, it is now possible to quantify, to a degree, what people talk about—anywhere from books and news to online social networks.

While some commentators have seen so-called “big data” as ending the need for theory, we argue these new data necessitate deeper theoretical understandings and better null model expectations. Human behaviour data are often compared against random baselines, but many social science research questions require more realistic, theory-informed null model expectations.

In particular for the social sciences, it is clear that the new models and theories we need to make sense of these new sources of large-scale data cannot rely on simple mathematical or statistical models alone, but rather need to incorporate knowledge from human behaviour. A good illustration of this difference between modelling natural and social behaviour is the study of how information spreads in social networks: while infectious diseases such as influenza might be captured by epidemiological models such as the SIR model, the transmission of information on social media can follow multiple different social mechanisms, some of which bear little resemblance to biological contagion.

Modelling the dynamics of public opinion

We presented ongoing work at the 5th International Conference on Computational Social Science, in Amsterdam, Netherlands, where we investigate how the effective number of issues holding public and media attention changes over time. Our data necessitate realistic, theory-informed models in order to ensure we answer our research question rather than report noise and artifacts in the data. To this end, we developed null models for the distribution of public attention over multiple issues. This is a relevant topic in the field of agenda setting, but also more broadly in the study of opinion dynamics and consensus formation. We investigate the diversity of issues within a public agenda, and compare the issue diversity in different data sources to a baseline expectation provided by our models.

Our data sources

We compared the behaviour predicted by our null models with data from public opinion polls and news media. For the former, we took data from British monthly attitudinal surveys collected by Ipsos MORI, who ask a representative sample of the UK population what they feel is the most important issue facing the country and code the responses into issue categories. The distribution of public attention over issues is not uniform: new issues are introduced over time, necessitating a realistic null model of our theoretical expectations for how public attention is distributed over an arbitrary number of issues.

Our second dataset consists of all articles from the German news magazine Der Spiegel, from 1947 to 2016. For this dataset, we looked at the patterns of language use over time using LDA topic modelling, and preliminary, manual inspection of the topics suggested they were typically related to issues in the policy agenda (e.g., defense, economy, environment).

Extracting the coverage dedicated to each topic in Der Spiegel over time allows us to study how the diversity of issues in a given dataset compares to an ensemble of random agendas of the same size. This can be calculated using the effective number of issues, which we use in a preprint of earlier work. When compared to an ensemble of random agendas, the public opinion polls show a lower effective number of issues at all points in time, indicating that despite the continuous shift of attention towards new issues, the total diversity of issues in the public agenda stays bounded.

Effective number of issues versus the number of articles published per week.
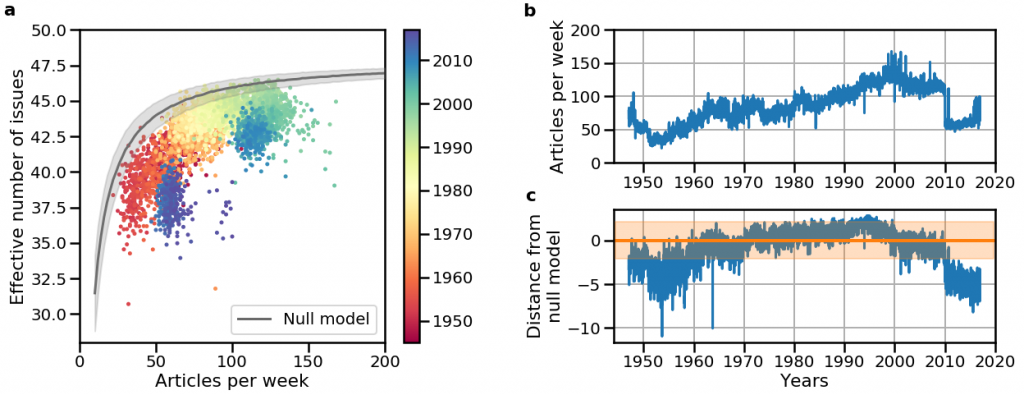
Panel (a) shows the number of articles per week in Der Spiegel, in comparison with the corresponding effective number of issues per week. In this panel, the color scale indicates publication year, and the grey line indicates the null model expectation (with one standard deviation) for the effective number of issues as a function of the number of articles. Panel (b) shows the number of articles per week decreases in 2010. However, the decrease in the effective number of issues by the news magazine appears to go beyond what would be expected. While the null model provides a close bound for most years, after 2010 the observed effective number of issues falls well below the null model expectation, which is shown with its 95% confidence interval in (c).

This analysis can also be performed when the number of issues is fixed, but the number of points composing each distribution of attention varies, which again requires a realistic expectation of how many issues we expect the news magazine to cover in a weekly edition with an arbitrary number of articles. This is the case of the news media data shown in panel (b) in the figure above. As the effective number of issues covered in a week might depend on the number of articles published, we compared every week with random samples of articles from Der Spiegel. The result is displayed in panel (a), which shows the effective number of issues observed in Der Spiegel stays below the null model prediction.

Panel (a) in the figure also shows that the magazine output drops after 2010. During the same period, its effective number of issues also moves further from the bound predicted by the null model, as shown in panel (c), suggesting this drop is not simply due to fewer articles, but indeed due to fewer issues covered by the news magazine. This resonates with the content of Der Spiegel at that time, as the financial crisis of 2008 led to increased coverage of economic matters, at the cost of other topics. Finally, beyond generating insights about policy agendas and public opinion, the null models we presented showcase how new models can provide useful insights to the study of how collective human behaviour. Our current work is further developing the null models to be able to understand how the rate at which agendas are observed (e.g., monthly vs. weekly) affects the data and, ultimately, to be able to control for this and other confounds when comparing different data sources.

New paper and algorithmic tools: Demographic inference and corrections for non-representativeness when working with multilingual social media data

In short:

  • We provide a new state of the art for inferring demographic attributes of social media profiles with deep learning in 32 languages in our recently released paper. Get the pretrained model or try out or Web demo.
  • We show how to estimate the probabilities to be on Twitter for different socio-demographic strata in over 1000 regions in the EU. Download them here.

Social media as survey substitutes?

Data representing societal attitudes and behaviors are of great value to policy makers, (social) scientists, and marketers. However, arriving at meaningful conclusions about society requires data to be representative of the targeted population; be it all citizens of the UK or all women under 40 living in France.

In questionnaires, the sample of people asked is ideally a representative microcosm of the target population, with each demographic group represented at their respective share. Unfortunately, surveys that fulfill this requirement are both costly and infrequent. At the same time, the rise of social media—e.g., Twitter or Facebook—provides a way to easily and inexpensively gather vast amounts of data that contain the feelings and everyday, unprompted opinions of users. They offer great potential for measuring statistics for health metrics, political outcomes, or general attitudes and beliefs.  Even better, social media produce these data in near real-time on a large scale, and some platforms make it easy to retrieve them. It is then not surprising that researchers have used such data with varying success to make inferences about infectious diseases [5, 6, 10], migration and tourism [1, 9, 13], and box office takings for films [4, 11] in larger offline populations.


Our two-stage approach debiases the non-representative Twitter data. It first uses deep learning to infer demographics with state-of-the-art accuracy from multilingual, profile-only data and, second, learns inclusion probabilities to create more representative samples for Europe-wide subregions

But of course there is a catch for using social media as survey substitutes or “Social Sensors”: Users from different demographic groups join platforms at different levels, and even among those who join, different levels of activity are prevalent. It follows that certain groups of society are particularly well represented while others are highly underrepresented on a given social platform. In the UK, for instance, young males are overrepresented among Twitter users compared to the national population [12]. Similarly, in the US men and residents of densely populated areas are more likely to be users of Twitter than other groups of the national population [7]. Hence, most of the time data gathered from social media platforms do not accurately represent offline populations and any conclusions to be drawn are inherently skewed. To put it bluntly, one can’t simply sum up all the posts from a platform where 80% of the users are under 35 years old and make a statement about the state of health or political preferences in the whole national population.

Wait, can’t we reweight?

Luckily, the issue of non-representative data is nothing particularly new. It is, in fact, the case with most surveys as well. The reasons range from non-response of participants to self-selection bias in online surveys, to name but a few.  Researchers have commonly dealt with this problem through sample reweighting. In its simplest form, this approach counts members of an underrepresented demographic group several times, to increase their statistical influence on the aggregated outcome proportional to their group’s share in the target population.

However, there is no robust approach for controlling biases that stem from non-representativeness in multilingual social media data.1 First, it is generally unknown to what extent certain groups of (national or regional) populations are represented on a given social media platform. Second, relevant demographic attributes such as age, gender and location are only explicitly given—or retrievable—for very few accounts or profiles. An additional source of noise is the prevalence of organizations and automated (“bot”) accounts on social media, which are counter-productive to accurate estimates of statistics in human target populations. These issues make it hard to apply correction techniques to social media data.

A new deep learning approach to infer age and gender for social media users in 32 languages

We took several steps to address this problem in our paper “Demographic Inference and Representative Population Estimates from Multilingual Social Media Data”, presented this week at the The Web Conference 2019 in San Francisco. We started by devising a deep learning model able to infer age, gender, and organization-vs-human status as attributes of users’ social media profiles. And we based this inference on both visual (profile picture) and textual (e.g., username) information types (or “modes”). Comparable existing approaches have been using only either mode, and most importantly, textual approaches have been almost exclusively focused on single languages, to the largest part English. In contrast, we offer the prediction of these attributes in 32 languages in our multimodal, multilingual, and multi-attribute model (M3). We trained M3 on multiple picture and text datasets, including IMDB, Wikipedia and Twitter.

One “trick” M3 uses is employing high-confidence predictions from the image classification task to create new training instances for the text modes of a profile, and vice versa, which is called co-training. Further, we transfer learned classification settings between languages via word-for-word translation and by using images as the common denominator between the languages.  By hiding some of the text attributes or the images during training, we additionally made sure that M3 doesn’t become over-reliant on one attribute type. And it paid off. For gender, M3 slightly outperforms commercial image classifiers on real Twitter data—and it is less biased by skin tones than other approaches. When provided several text attributes of Twitter profiles, it outperforms text-based state of the art as well. For age, M3 substantially outperforms the commercial image classifiers (no text classifiers exist for this task). It is also able to distinguish humans from organizations with over 16% more accuracy than the next-closest system. Given these results, M3 can be considered the new state-of-the-art for the age and gender prediction task on multilingual social media profiles. And we are releasing a pre-trained classifier as an easy-to-use Python library under a free license for non-commercial use. Download it here. For a quick look into the functionalities, try out our Web-demo for demographic attribute inference here

Estimating rates for inclusion on Twitter: Demographics and location are indeed needed

While the inferred demographics by M3 could be used for a range of other tasks as well, for our research, we wanted to specifically know how to correct the inherent skew of social media populations with this new data. To test this, we evaluated which reweighting steps one needs to take to conclude the demographic composition of a region within Europe from the respective composition of users from that region on Twitter.  Specifically, we used population counts from the census in Europe-wide subregions (NUTS3). The reasoning: Not every geographic region is likely to have the same rate of inclusion of its citizens on Twitter; this is on top of the effect of certain age groups and genders joining social media more readily. I.e., simply assuming that women aged 30-40 have the same likelihood to join Twitter everywhere might be wrong. To assign locations to profiles, we used the method by Compton et al. [3].


Regression models with increasing granularity of data decrease population prediction error (measured as MAPE) from Twitter to European regions. The map indicates per-region MAPE for the best-performing model (dark blue is worst).

With each one of 1101 EU sub-country regions as the units in a regression model, we tried to predict the number of people in different age-gender groups (or “strata”)—for example “Men between 30 and 39”—from the regions’ respective strata on Twitter.  Specifically, we used a multilevel regression, allowing each country to have its own inclusion rates.

We also tried 5 different models and gave them different granularities of data to work with. E.g., the simplest model only has information about how many people in total live in one region and are on Twitter in that region, while the most complex model is built on the exact strata counts in the census data and on Twitter, to learn much more fine-grained inclusion rates. In the end, the most complex model indeed performed best, showing that inferring this detailed kind of demographic information from M3 is useful to correct different inclusion rates. We also showed that not considering the country-specific inclusion rates leads to the worst predictions. The Twitter inclusion rates we inferred for each stratum and NUTS3 region are available from http://euagendas.org/inclusionprobs .

The result of our work is a holistic multilingual solution to address the problem of the non-representativeness of social media data. These results pave the way for drawing more accurate conclusions about societal attitudes and behaviors by laying a foundation of representative population sampling in social media.  For more information, have a look at the paper or write to us at hello@euagendas.org


Footnotes:

  1. Note that reweighting/post-stratifying corrects for different representation of strata in the sample (here: social media platform), respective to the ground population based on the used demographic features, but not for basic differences in which kind of person (in terms of any other feature) joins a social media platform.

References:

  • [1] Daniele Barchiesi, Helen Susannah Moat, Christian Alis, Steven Bishop, and Tobias Preis. 2015. Quantifying International Travel Flows Using Flickr. PLOS ONE 10, 7 (07 2015), 1-8.  https://doi.org/10.1371/journal.pone.0128470
  • [2] Jelke G Bethlehem and Wouter J Keller. 1987. Linear weighting of sample survey data. Journal of official Statistics 3, 2 (1987), 141–153.
  • [3] Ryan Compton, David Jurgens, and David Allen. 2014. Geotagging One Hundred Million Twitter Accounts with Total Variation Minimization. In IEEE Conference on BigData.
  • [4] Brian de Silva and Ryan Compton. 2014. Prediction of Foreign Box Office Revenues Based on Wikipedia Page Activity. CoRR abs/1405.5924 (2014). arXiv:1405.5924 http://arxiv.org/abs/1405.5924
  • [5] Nicholas Generous, Geoffrey Fairchild, Alina Deshpande, Sara Y. Del Valle, and Reid Priedhorsky. 2014. Global Disease Monitoring and Forecasting with Wikipedia. PLOS Computational Biology 10, 11 (11 2014), 1-16. https://doi.org/10.1371/journal.pcbi.1003892
  • [6] Jeremy Ginsberg, Matthew H. Mohebbi, Rajan S. Patel, Lynnette Brammer, Mark S. Smolinski, and Larry Brilliant. 2008. Detecting influenza epidemics using search engine query data. Nature 457 (nov 2008), 1012. https://doi.org/10.1038/nature 0763410.1038/nature07634
  • [7] Brent Hecht and Monica Stephens. 2014. A Tale of Cities: Urban Biases in Volunteered Geographic Information. In Proceedings of ICWSM. https://www.aaai.org/ocs/index.php/
    ICWSM/ICWSM14/paper/view/8114
  • [8] D. Holt and T. M. F. Smith. 1979. Post Stratification. Journal of the Royal Statistical Society. Series A (General) 142, 1 (1979), 33–46. http://www.jstor.org/stable/2344652
  • [9] Fabio Lamanna, Maxime Lenormand, María Henar Salas-Olmedo, Gustavo Romanillos, Bruno Gonçalves, and José J Ramasco. 2018. Immigrant community integratioin in world cities. PloS one 13, 3 (2018), e0191612.
  • [10] David Lazer, Ryan Kennedy, Gary King, and Alessandro Vespignami. 2014. The Parable of Google Flu: Traps in Big Data Analysis. Science 343, 6167 (2014), 1203-1205.
  • [11] Márton Mestyán, Taha Yasseri, and JÃąnos Kertész. 2013. Early Prediction of Movie Box Office Success Based on Wikipedia Activity Big Data. PLOS ONE 8, 8 (08 2013), 1–8. https://doi.org/10.1371/journal.pone.0071226
  • [12] Luke Sloan. 2017. Who Tweets in the United Kingdom? Profiling the Twitter Population Using the British Social Attitudes Survey 2015. Social Media + Society 3, 1 (2017), 2056305117698981.
  • [13] Emilio Zagheni, Ingmar Weber, and Krishna Gummadi. 2017. Leveraging Facebook’s Advertising Platform to Monitor Stocks of Migrants. Population and Development Review 43, 4 (2017), 721–734.