
In short:
- We provide a new state of the art for inferring demographic attributes of social media profiles with deep learning in 32 languages in our recently released paper. Get the pretrained model or try out or Web demo.
- We show how to estimate the probabilities to be on Twitter for different socio-demographic strata in over 1000 regions in the EU. Download them here.
Social media as survey substitutes?
Data representing societal attitudes and behaviors are of great value to policy makers, (social) scientists, and marketers. However, arriving at meaningful conclusions about society requires data to be representative of the targeted population; be it all citizens of the UK or all women under 40 living in France.
In questionnaires, the sample of people asked is ideally a representative microcosm of the target population, with each demographic group represented at their respective share. Unfortunately, surveys that fulfill this requirement are both costly and infrequent. At the same time, the rise of social media—e.g., Twitter or Facebook—provides a way to easily and inexpensively gather vast amounts of data that contain the feelings and everyday, unprompted opinions of users. They offer great potential for measuring statistics for health metrics, political outcomes, or general attitudes and beliefs. Even better, social media produce these data in near real-time on a large scale, and some platforms make it easy to retrieve them. It is then not surprising that researchers have used such data with varying success to make inferences about infectious diseases [5, 6, 10], migration and tourism [1, 9, 13], and box office takings for films [4, 11] in larger offline populations.
But of course there is a catch for using social media as survey substitutes or “Social Sensors”: Users from different demographic groups join platforms at different levels, and even among those who join, different levels of activity are prevalent. It follows that certain groups of society are particularly well represented while others are highly underrepresented on a given social platform. In the UK, for instance, young males are overrepresented among Twitter users compared to the national population [12]. Similarly, in the US men and residents of densely populated areas are more likely to be users of Twitter than other groups of the national population [7]. Hence, most of the time data gathered from social media platforms do not accurately represent offline populations and any conclusions to be drawn are inherently skewed. To put it bluntly, one can’t simply sum up all the posts from a platform where 80% of the users are under 35 years old and make a statement about the state of health or political preferences in the whole national population.
Wait, can’t we reweight?
Luckily, the issue of non-representative data is nothing particularly new. It is, in fact, the case with most surveys as well. The reasons range from non-response of participants to self-selection bias in online surveys, to name but a few. Researchers have commonly dealt with this problem through sample reweighting. In its simplest form, this approach counts members of an underrepresented demographic group several times, to increase their statistical influence on the aggregated outcome proportional to their group’s share in the target population.
However, there is no robust approach for controlling biases that stem from non-representativeness in multilingual social media data.1 First, it is generally unknown to what extent certain groups of (national or regional) populations are represented on a given social media platform. Second, relevant demographic attributes such as age, gender and location are only explicitly given—or retrievable—for very few accounts or profiles. An additional source of noise is the prevalence of organizations and automated (“bot”) accounts on social media, which are counter-productive to accurate estimates of statistics in human target populations. These issues make it hard to apply correction techniques to social media data.
A new deep learning approach to infer age and gender for social media users in 32 languages
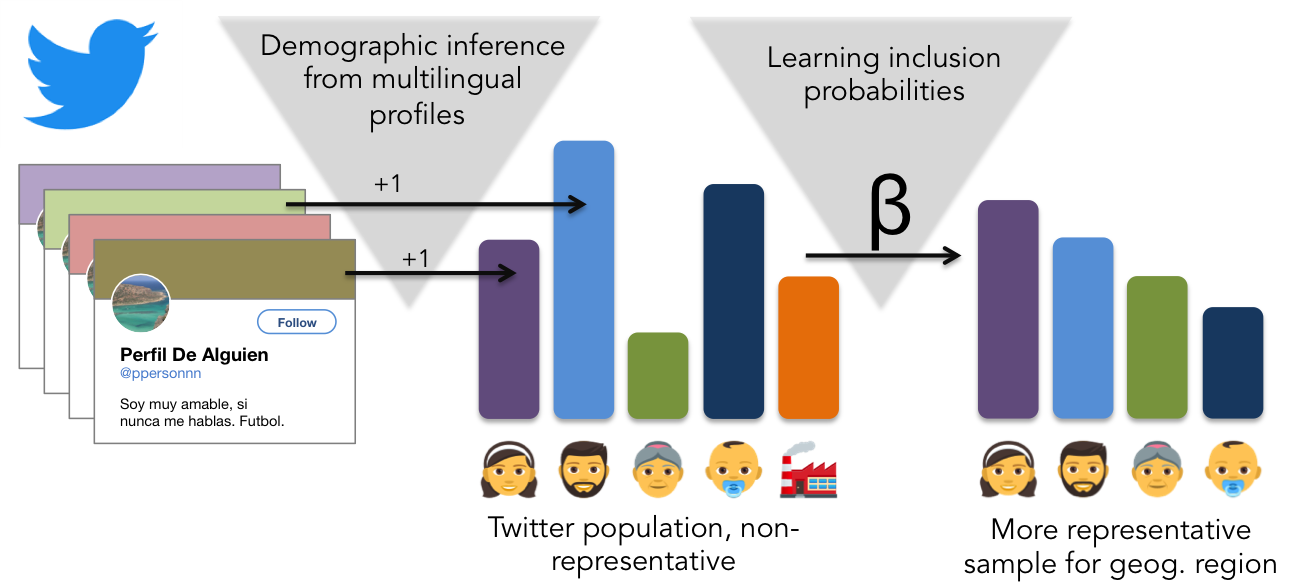
We took several steps to address this problem in our paper “Demographic Inference and Representative Population Estimates from Multilingual Social Media Data”, presented this week at the The Web Conference 2019 in San Francisco. We started by devising a deep learning model able to infer age, gender, and organization-vs-human status as attributes of users’ social media profiles. And we based this inference on both visual (profile picture) and textual (e.g., username) information types (or “modes”). Comparable existing approaches have been using only either mode, and most importantly, textual approaches have been almost exclusively focused on single languages, to the largest part English. In contrast, we offer the prediction of these attributes in 32 languages in our multimodal, multilingual, and multi-attribute model (M3). We trained M3 on multiple picture and text datasets, including IMDB, Wikipedia and Twitter.
One “trick” M3 uses is employing high-confidence predictions from the image classification task to create new training instances for the text modes of a profile, and vice versa, which is called co-training. Further, we transfer learned classification settings between languages via word-for-word translation and by using images as the common denominator between the languages. By hiding some of the text attributes or the images during training, we additionally made sure that M3 doesn’t become over-reliant on one attribute type. And it paid off. For gender, M3 slightly outperforms commercial image classifiers on real Twitter data—and it is less biased by skin tones than other approaches. When provided several text attributes of Twitter profiles, it outperforms text-based state of the art as well. For age, M3 substantially outperforms the commercial image classifiers (no text classifiers exist for this task). It is also able to distinguish humans from organizations with over 16% more accuracy than the next-closest system. Given these results, M3 can be considered the new state-of-the-art for the age and gender prediction task on multilingual social media profiles. And we are releasing a pre-trained classifier as an easy-to-use Python library under a free license for non-commercial use. Download it here. For a quick look into the functionalities, try out our Web-demo for demographic attribute inference here.
Estimating rates for inclusion on Twitter: Demographics and location are indeed needed
While the inferred demographics by M3 could be used for a range of other tasks as well, for our research, we wanted to specifically know how to correct the inherent skew of social media populations with this new data. To test this, we evaluated which reweighting steps one needs to take to conclude the demographic composition of a region within Europe from the respective composition of users from that region on Twitter. Specifically, we used population counts from the census in Europe-wide subregions (NUTS3). The reasoning: Not every geographic region is likely to have the same rate of inclusion of its citizens on Twitter; this is on top of the effect of certain age groups and genders joining social media more readily. I.e., simply assuming that women aged 30-40 have the same likelihood to join Twitter everywhere might be wrong. To assign locations to profiles, we used the method by Compton et al. [3].
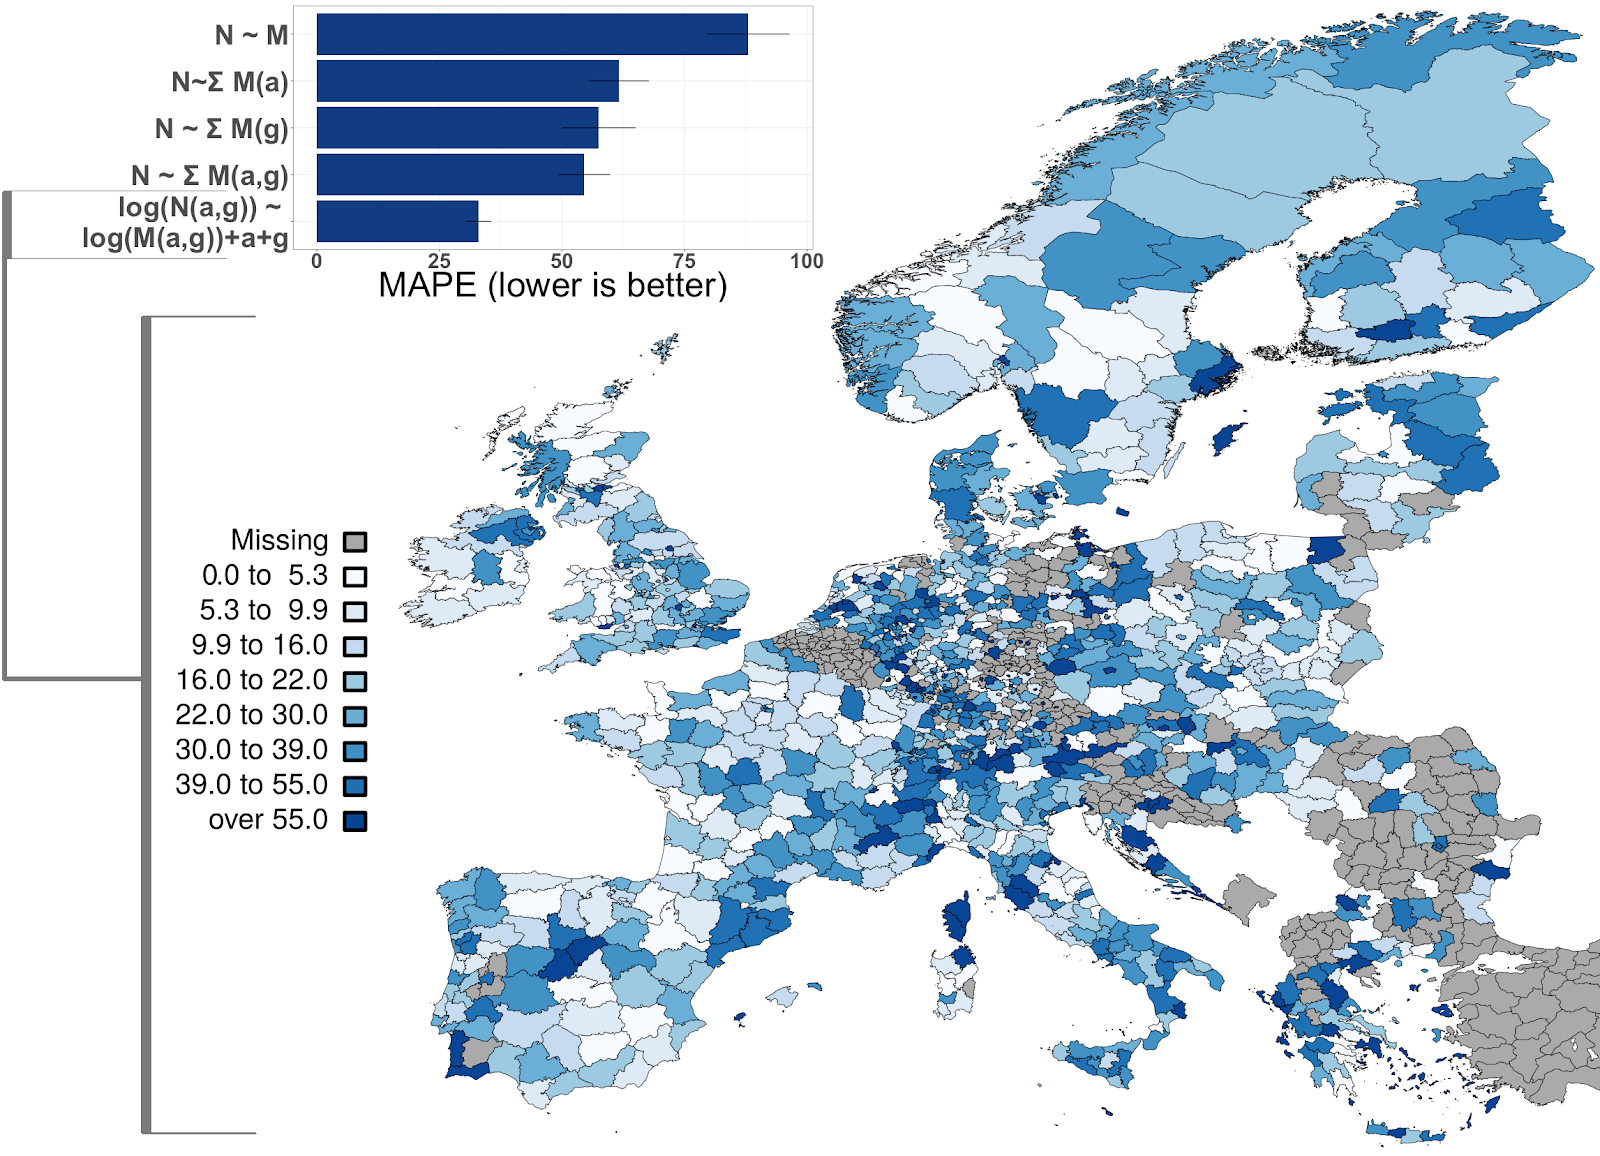
With each one of 1101 EU sub-country regions as the units in a regression model, we tried to predict the number of people in different age-gender groups (or “strata”)—for example “Men between 30 and 39”—from the regions’ respective strata on Twitter. Specifically, we used a multilevel regression, allowing each country to have its own inclusion rates.
We also tried 5 different models and gave them different granularities of data to work with. E.g., the simplest model only has information about how many people in total live in one region and are on Twitter in that region, while the most complex model is built on the exact strata counts in the census data and on Twitter, to learn much more fine-grained inclusion rates. In the end, the most complex model indeed performed best, showing that inferring this detailed kind of demographic information from M3 is useful to correct different inclusion rates. We also showed that not considering the country-specific inclusion rates leads to the worst predictions. The Twitter inclusion rates we inferred for each stratum and NUTS3 region are available from http://euagendas.org/inclusionprobs .
The result of our work is a holistic multilingual solution to address the problem of the non-representativeness of social media data. These results pave the way for drawing more accurate conclusions about societal attitudes and behaviors by laying a foundation of representative population sampling in social media. For more information, have a look at the paper or write to us at hello@euagendas.org
Footnotes:
- Note that reweighting/post-stratifying corrects for different representation of strata in the sample (here: social media platform), respective to the ground population based on the used demographic features, but not for basic differences in which kind of person (in terms of any other feature) joins a social media platform.
References:
- [1] Daniele Barchiesi, Helen Susannah Moat, Christian Alis, Steven Bishop, and Tobias Preis. 2015. Quantifying International Travel Flows Using Flickr. PLOS ONE 10, 7 (07 2015), 1-8. https://doi.org/10.1371/journal.pone.0128470
- [2] Jelke G Bethlehem and Wouter J Keller. 1987. Linear weighting of sample survey data. Journal of official Statistics 3, 2 (1987), 141–153.
- [3] Ryan Compton, David Jurgens, and David Allen. 2014. Geotagging One Hundred Million Twitter Accounts with Total Variation Minimization. In IEEE Conference on BigData.
- [4] Brian de Silva and Ryan Compton. 2014. Prediction of Foreign Box Office Revenues Based on Wikipedia Page Activity. CoRR abs/1405.5924 (2014). arXiv:1405.5924 http://arxiv.org/abs/1405.5924
- [5] Nicholas Generous, Geoffrey Fairchild, Alina Deshpande, Sara Y. Del Valle, and Reid Priedhorsky. 2014. Global Disease Monitoring and Forecasting with Wikipedia. PLOS Computational Biology 10, 11 (11 2014), 1-16. https://doi.org/10.1371/journal.pcbi.1003892
- [6] Jeremy Ginsberg, Matthew H. Mohebbi, Rajan S. Patel, Lynnette Brammer, Mark S. Smolinski, and Larry Brilliant. 2008. Detecting influenza epidemics using search engine query data. Nature 457 (nov 2008), 1012. https://doi.org/10.1038/nature 0763410.1038/nature07634
- [7] Brent Hecht and Monica Stephens. 2014. A Tale of Cities: Urban Biases in Volunteered Geographic Information. In Proceedings of ICWSM. https://www.aaai.org/ocs/index.php/
ICWSM/ICWSM14/paper/view/8114 - [8] D. Holt and T. M. F. Smith. 1979. Post Stratification. Journal of the Royal Statistical Society. Series A (General) 142, 1 (1979), 33–46. http://www.jstor.org/stable/2344652
- [9] Fabio Lamanna, Maxime Lenormand, María Henar Salas-Olmedo, Gustavo Romanillos, Bruno Gonçalves, and José J Ramasco. 2018. Immigrant community integratioin in world cities. PloS one 13, 3 (2018), e0191612.
- [10] David Lazer, Ryan Kennedy, Gary King, and Alessandro Vespignami. 2014. The Parable of Google Flu: Traps in Big Data Analysis. Science 343, 6167 (2014), 1203-1205.
- [11] Márton Mestyán, Taha Yasseri, and JÃąnos Kertész. 2013. Early Prediction of Movie Box Office Success Based on Wikipedia Activity Big Data. PLOS ONE 8, 8 (08 2013), 1–8. https://doi.org/10.1371/journal.pone.0071226
- [12] Luke Sloan. 2017. Who Tweets in the United Kingdom? Profiling the Twitter Population Using the British Social Attitudes Survey 2015. Social Media + Society 3, 1 (2017), 2056305117698981.
- [13] Emilio Zagheni, Ingmar Weber, and Krishna Gummadi. 2017. Leveraging Facebook’s Advertising Platform to Monitor Stocks of Migrants. Population and Development Review 43, 4 (2017), 721–734.